Certain Uncertainty – a dataphysicalization project by Kay Schröder and Jules Sinsel. Photos by Björn Giesbrecht.
Visual Encoding
Water stress or scarcity does always need to be reflected in context. While some parts of the world are only sparsely populated, the impact and mitigation of water stress in densely populated areas is potentially critical. While most water stress mappings focus on communicating the water stress within a tempo-spatial context, this project aims to map the water stress of selected capitals within the context of the global population density to enable the viewer to explore the interaction between both dimensions in a meaningful way. The water stress of each of the selected capitals is encoded in red semitransparent epoxy discs representing four dimensions: the latitude and longitude that puts the disc in the accurate spatial context, a radius reflecting the humans living in the area, and a height representing the projected water stress. The projection space – an elevation map showing the population density of the world – is made of wood and shaped with a CNC cutter based on demographic data. The surface is coated with multi-layer high pigmented color to allow accurate color reflections of the water stress epoxy discs. Through focusing strongly on the data itself and removing all cartographic borderlines, an abstract space of mountain ranges remains, showing the world as a spatial accumulation of humans confronted with increasingly changing environmental conditions.
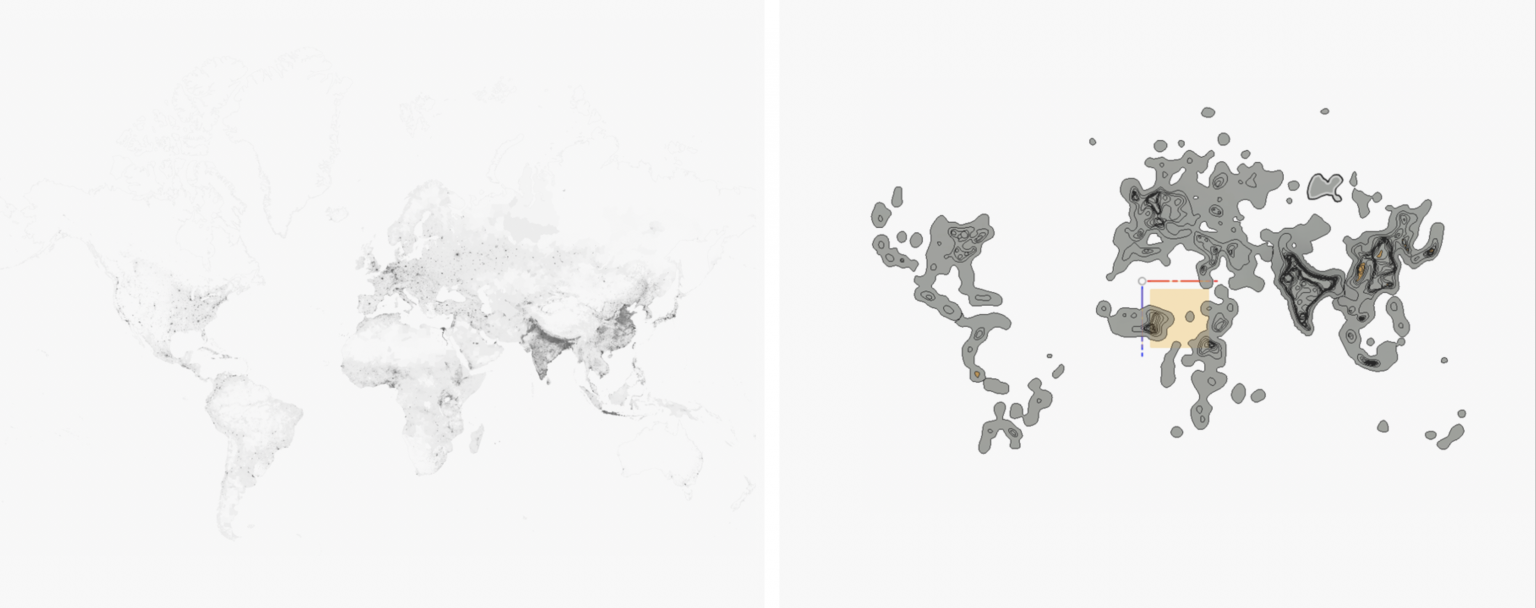
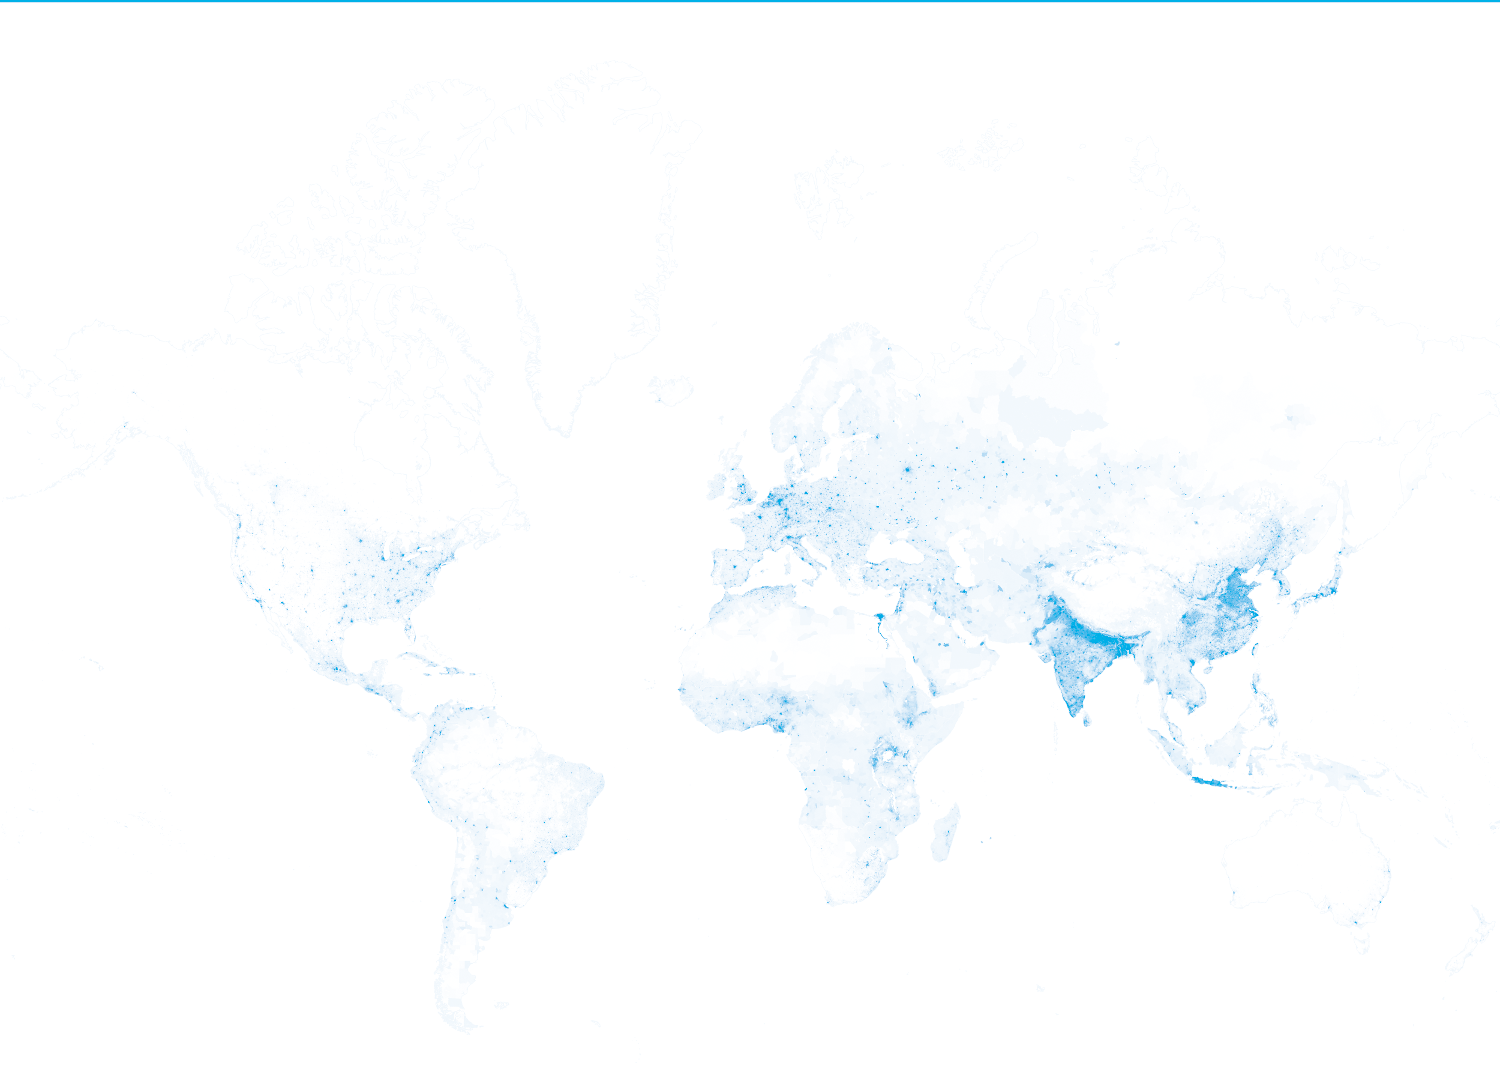
In order to realize the installation, population density mountains must be created. This first requires data that can be used to design this part of the model. A render based on data from Nasa was used. This visualization shows the population density in the world by color (heat map).
The image as a data file was used as input for generating the 3D model with Houdini. The figure of the data tree in Houdini shows how the image is directed to the mountain landscape; this tree can be divided into four segments. In the first part, the visualization is converted into points that have the color of the underlying pixels, this color is a vector. Based on the length of this vector, the points are moved in the normal direction, creating a mountain landscape. Then the mesh of this mountain range is rearranged so that the vertices are more evenly distributed, which is necessary for a clean result. The mountain range is then sliced to reveal the layers. In the final stages, the flat layers (cuts) only need to be extruded according to the thickness of the layers. After that, the model is ready to be produced.
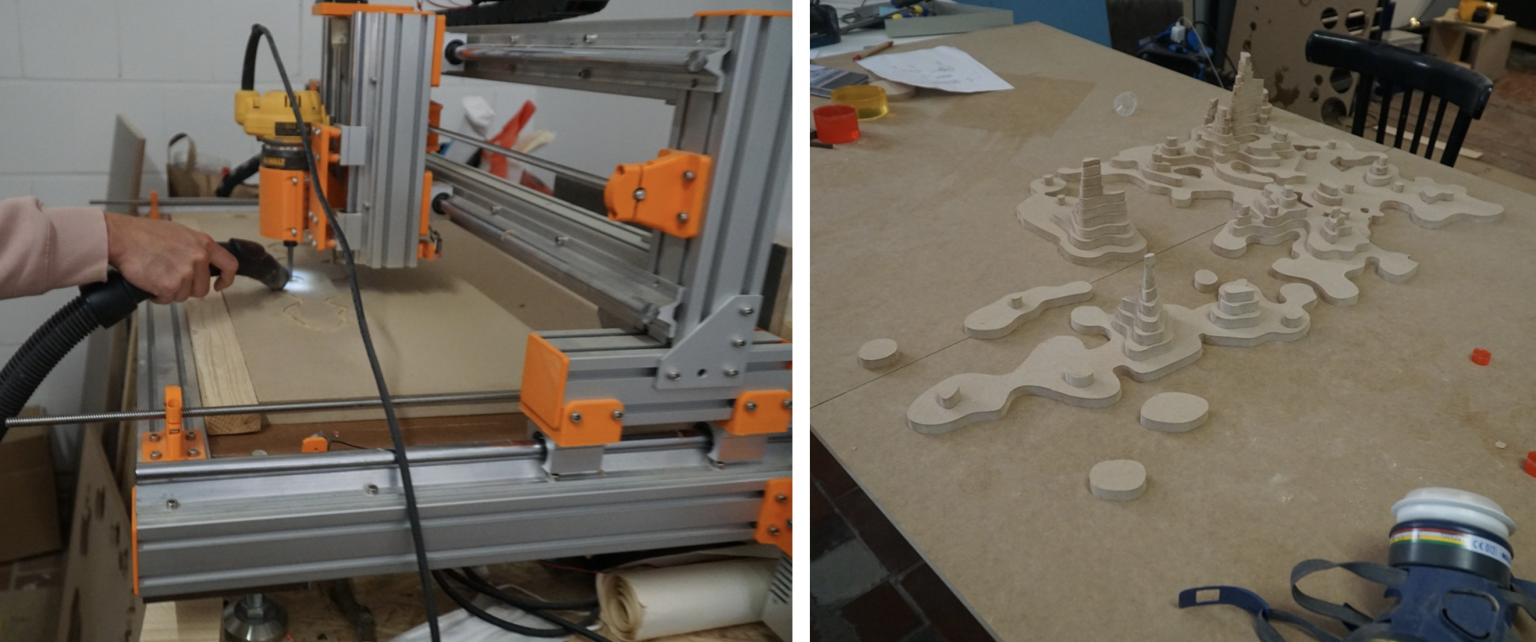
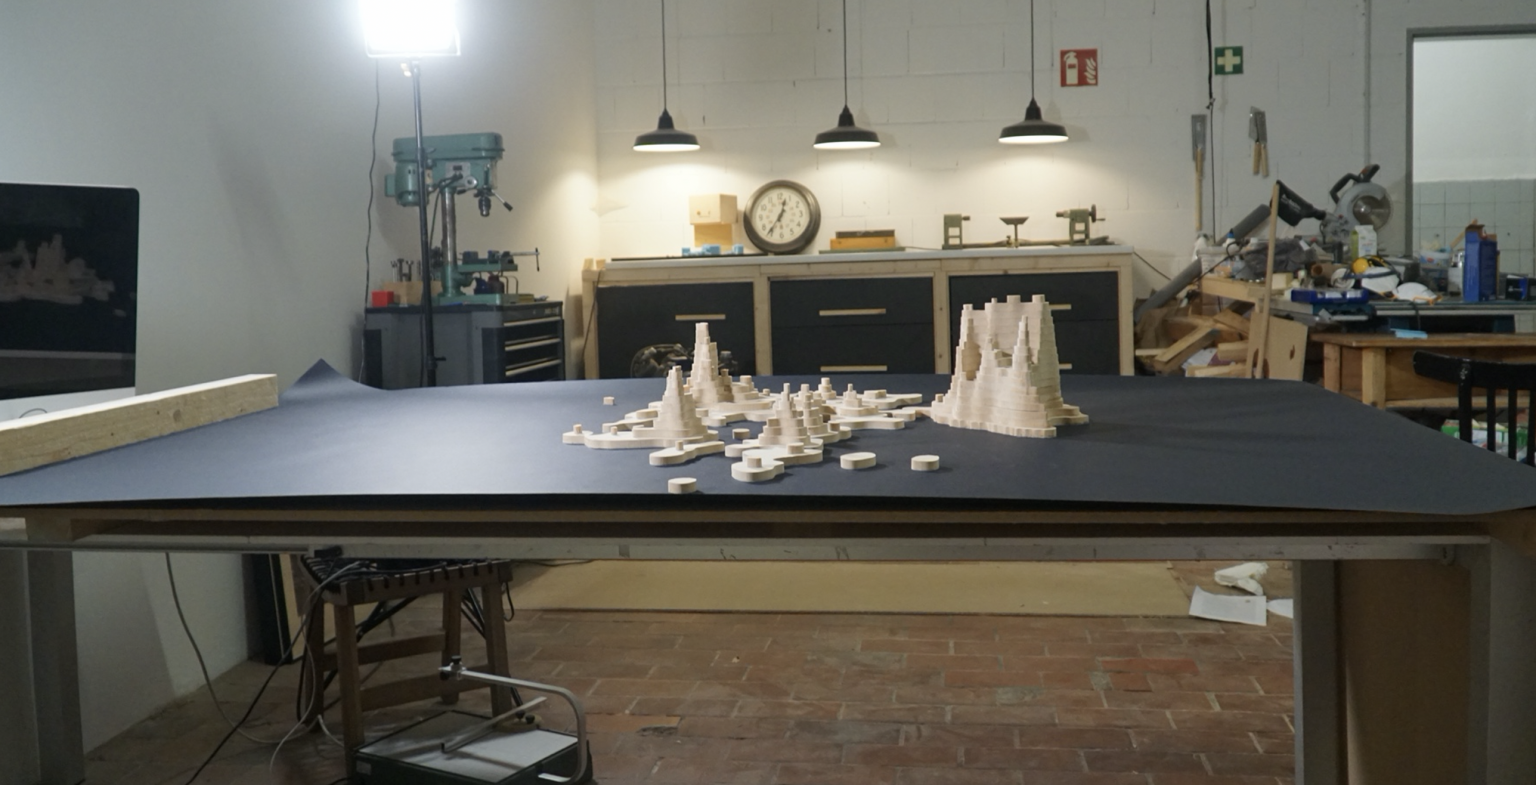
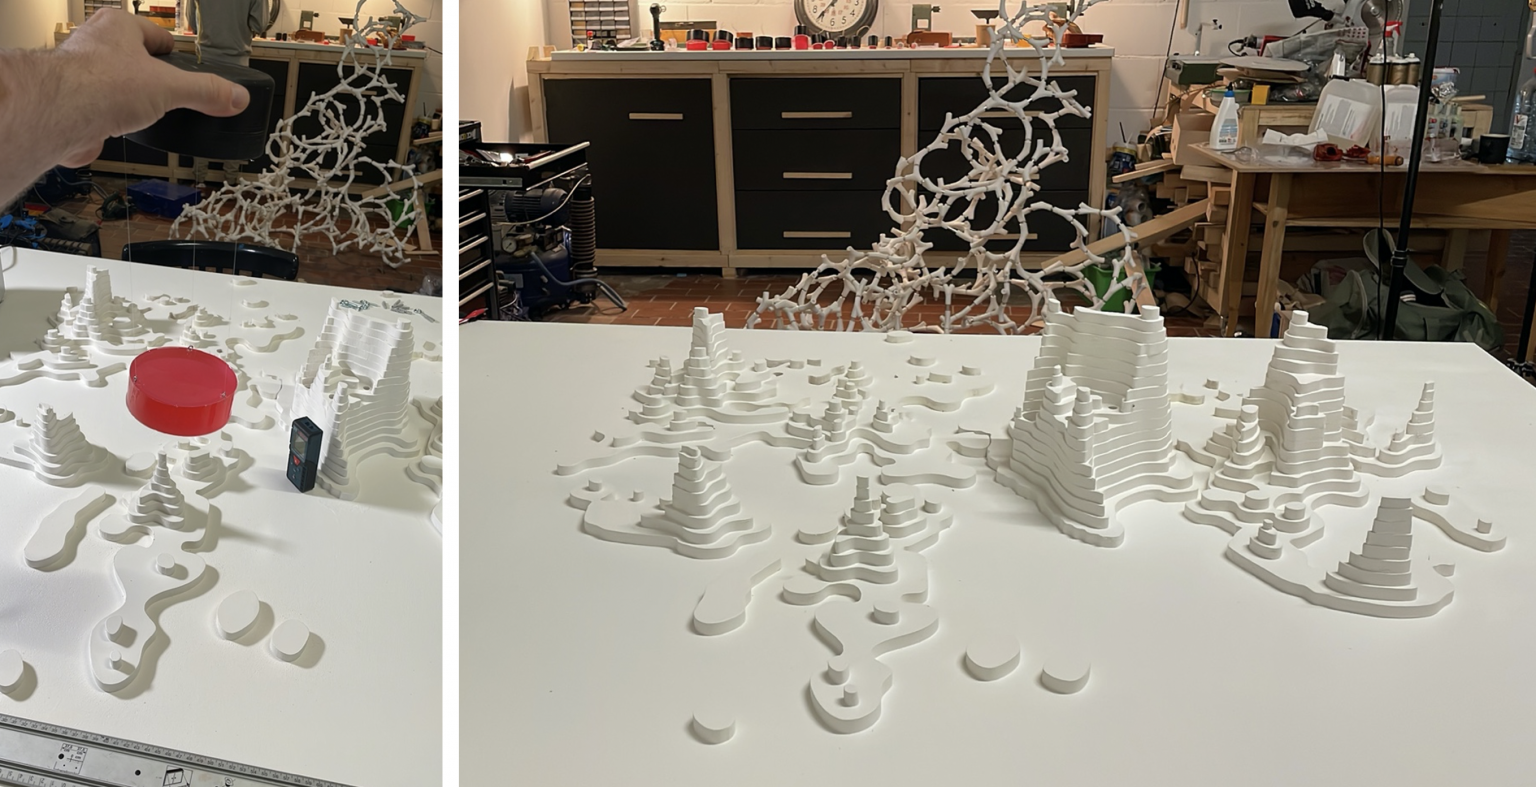
Before the model can be cut out, it has to be reorganized so that the CNC cutter understands how to cut it out. Each layer is cut out of a separate plate, for which the Fusion 360 software was used. This software wrote a gcode that allowed the cutter to cut out the model. After all the models were cut out, the parts could be assembled into the landscape.
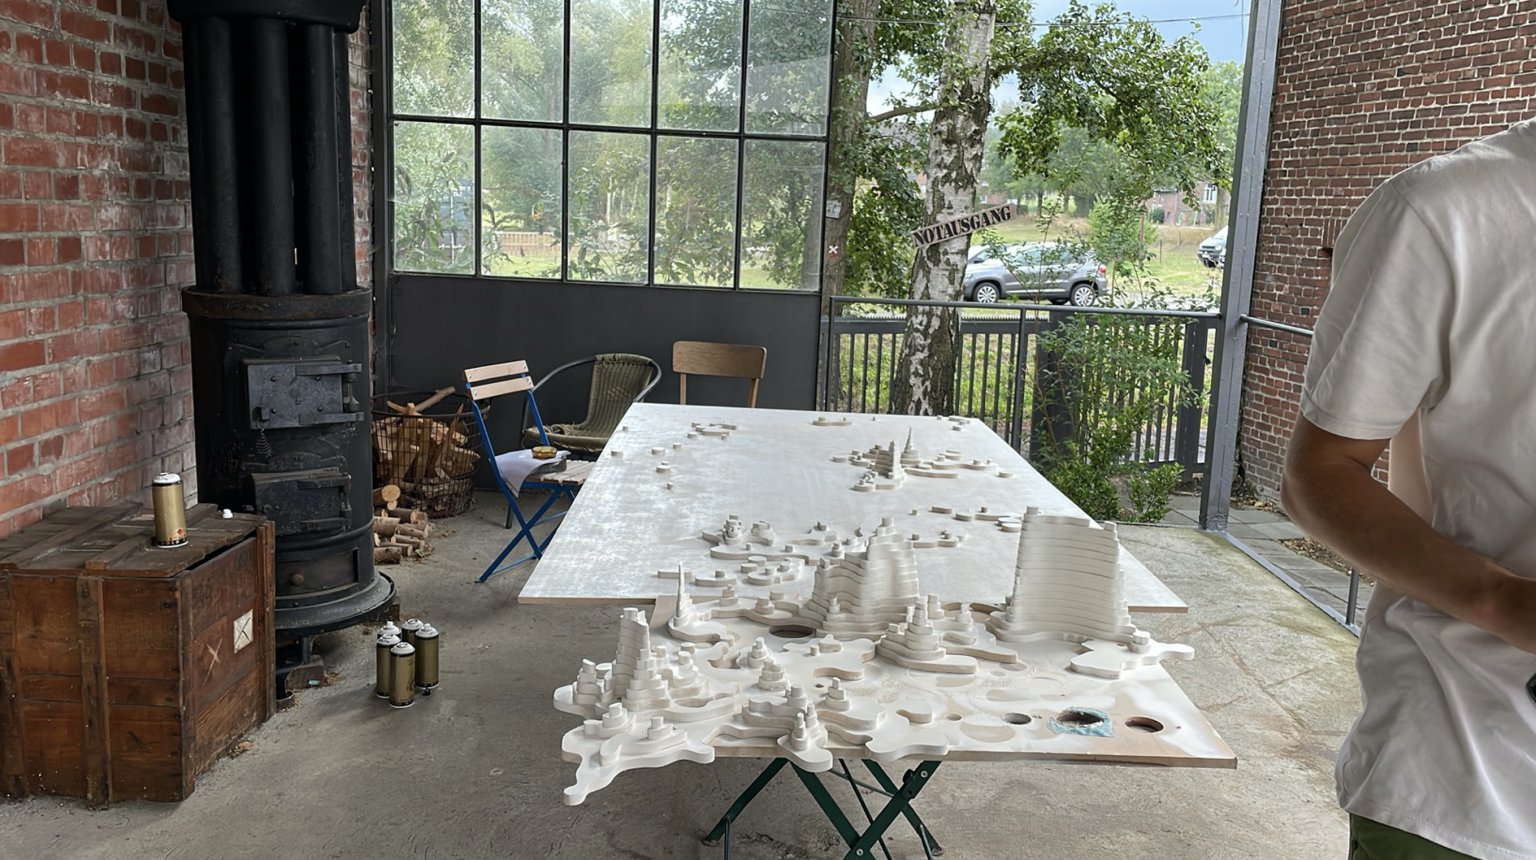
We used a overhead projection of the geodata mapping to accurately position the individual layers of the population density map on their respective positions. In a next step all individual parts were glued together with wood glue.
Colouring and coating
Then the individual layers were alternately coated with highly pigmented lacquer, sanded and surface-treated. After a 12-fold coating, the surface properties were suitable for optical data projection.
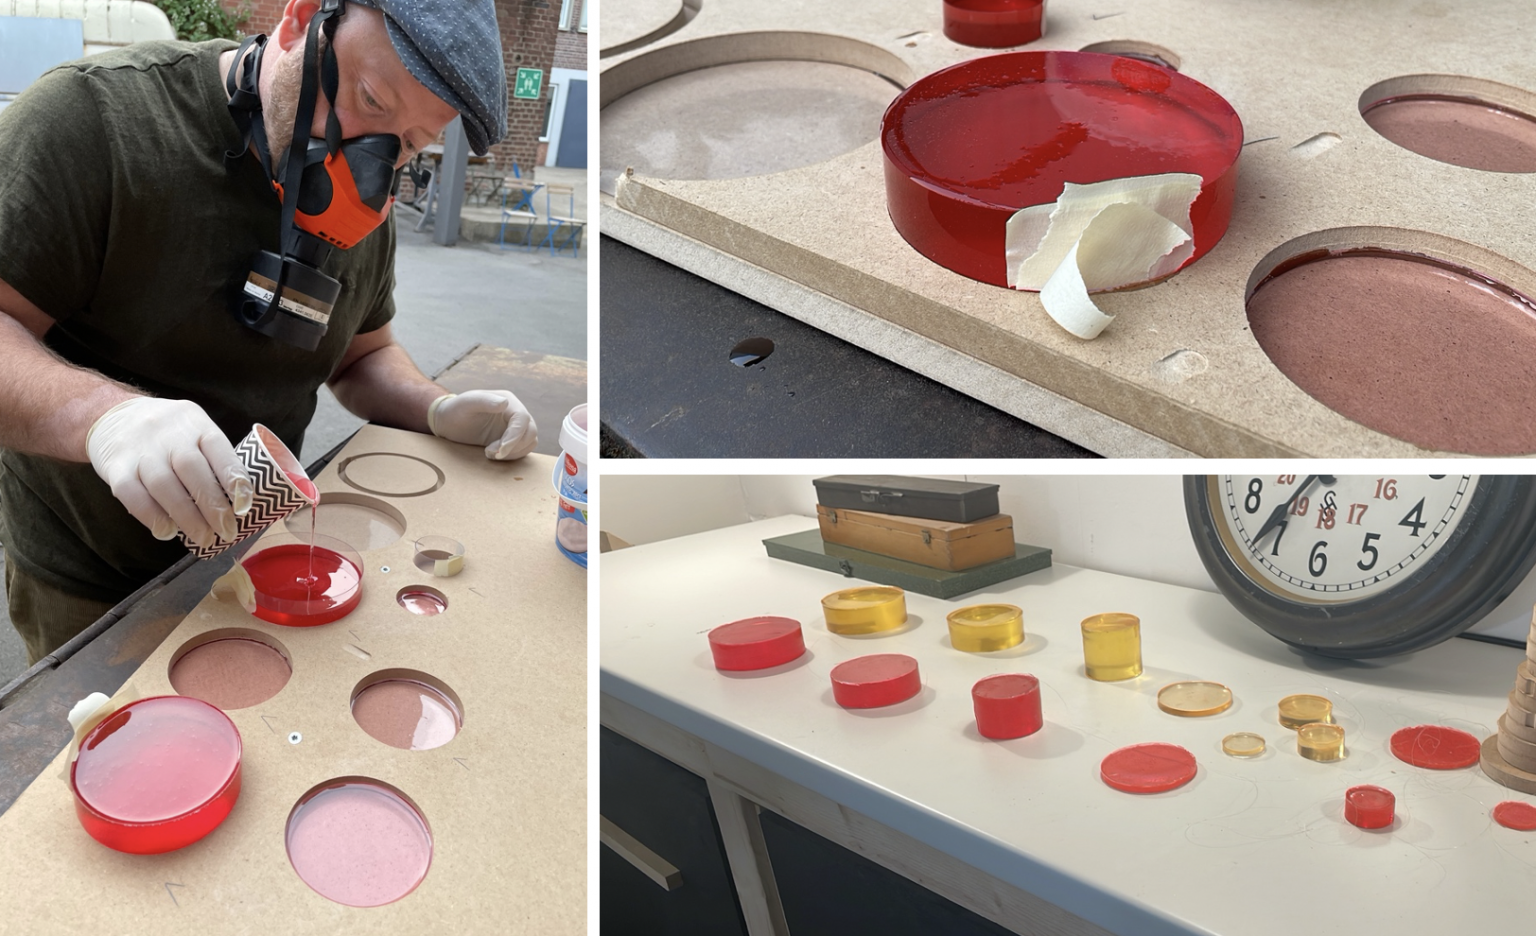
Testing Pigments for water stress projections
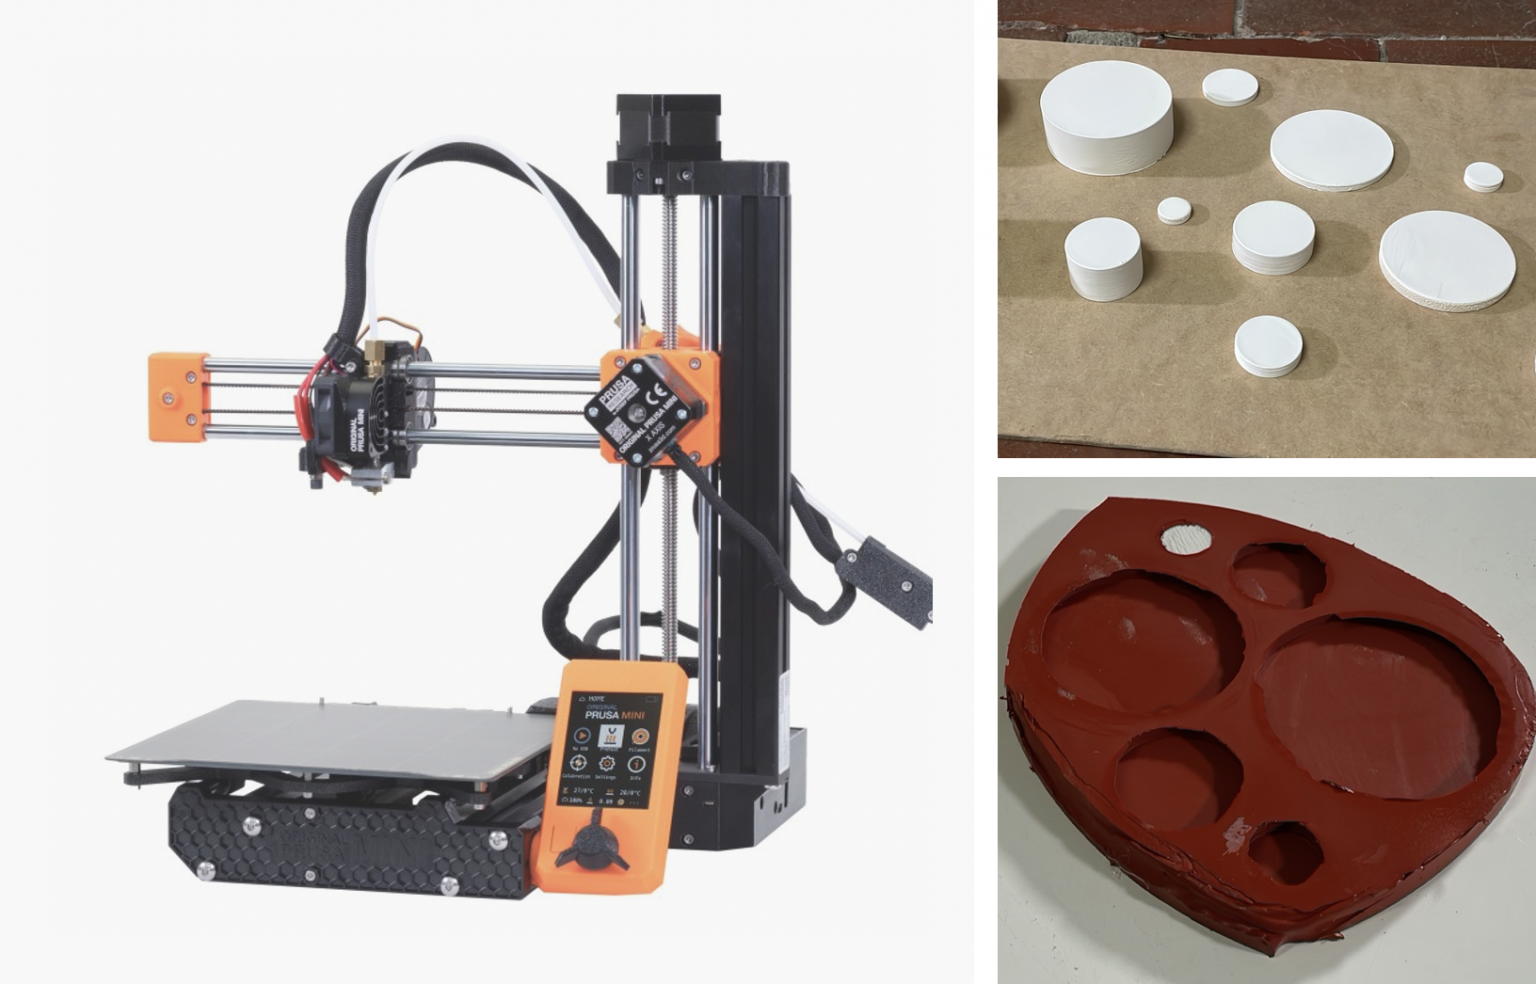
With an iterative, test based process, several material studies were conducted to figure out which pigment type and epoxy mixing ratio is suitable to project the required color space dependent on the thickness of the discs.
Water stress filters and silicon moulds
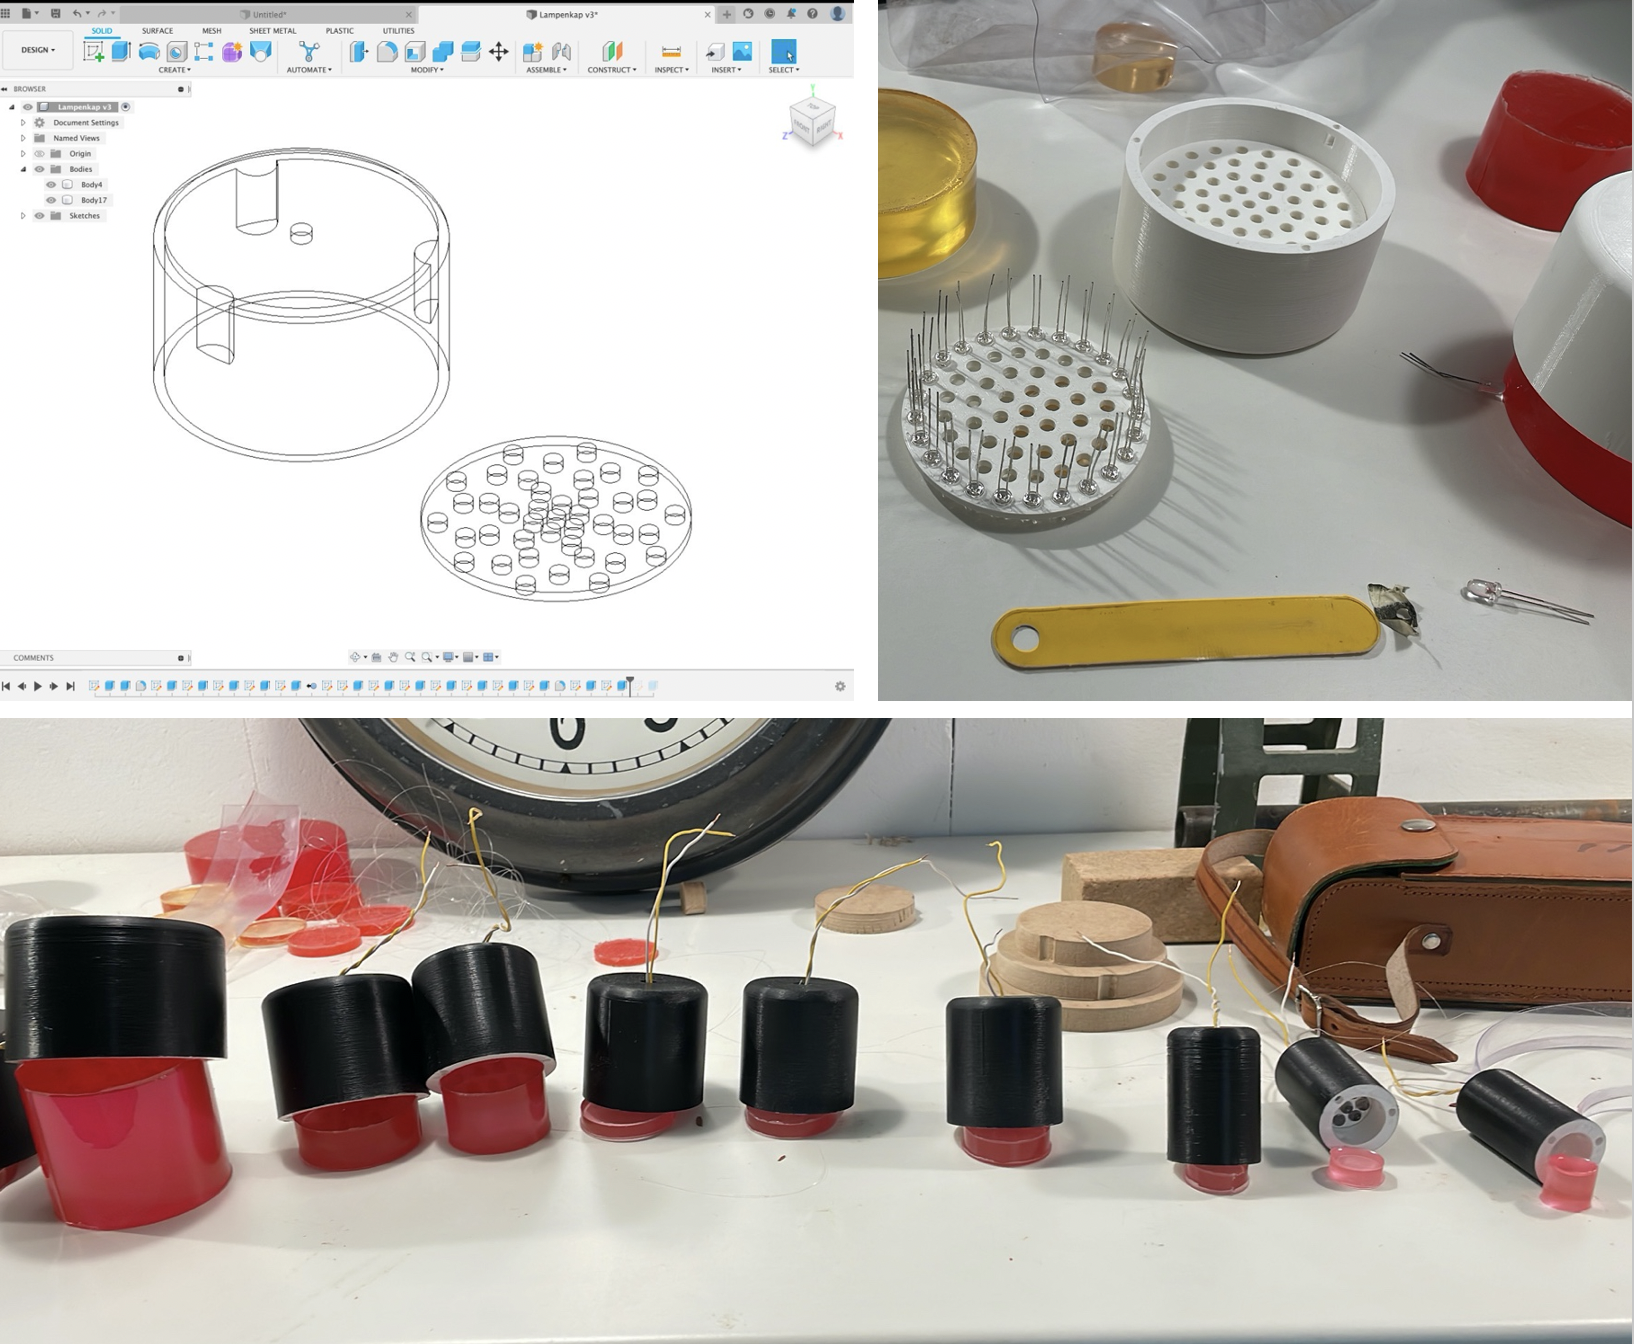
The lenses floating above the mountain landscape have dimensions based on water stress and population data of the selected cities. To produce these cylinders in the exact dementias as the data, the models were 3d printed. The cylinders are drawn in Autodesk Fushion 360 and then converted with the Prusa slicer to the gcode that the printer utilizes to construct the cylinders.
Lightspots and color filters
The lighting system has the same diameter as the cylinders. The lights are designed in Autodesk Fusion 360, consisting of two parts; the body and the holder for the LEDs. The body has a mounting system with a fit for the holder and recesses to support the cylinders. Functions generate the model in the CAD file. When the diameter of the cylinder is adjusted, the size of the carrier changes, and the number and location of perforations adjust accordingly. Both parts were 3d printed by generating a gcode with the Prusa slicer in PLA. Power LEDs were soldered to the resistors and attached to mount the lights in the indoor system. This procedure was performed for all cities.
A dataphysicalization project about waterstress, take a look at the project documentation for the underlying concepts.
The data of the spatial mappings based on the NASA datacenter for socioeconomic data . The water stress data was processed based on the aqueduct water risk atlas.

